CREATING REPORT :
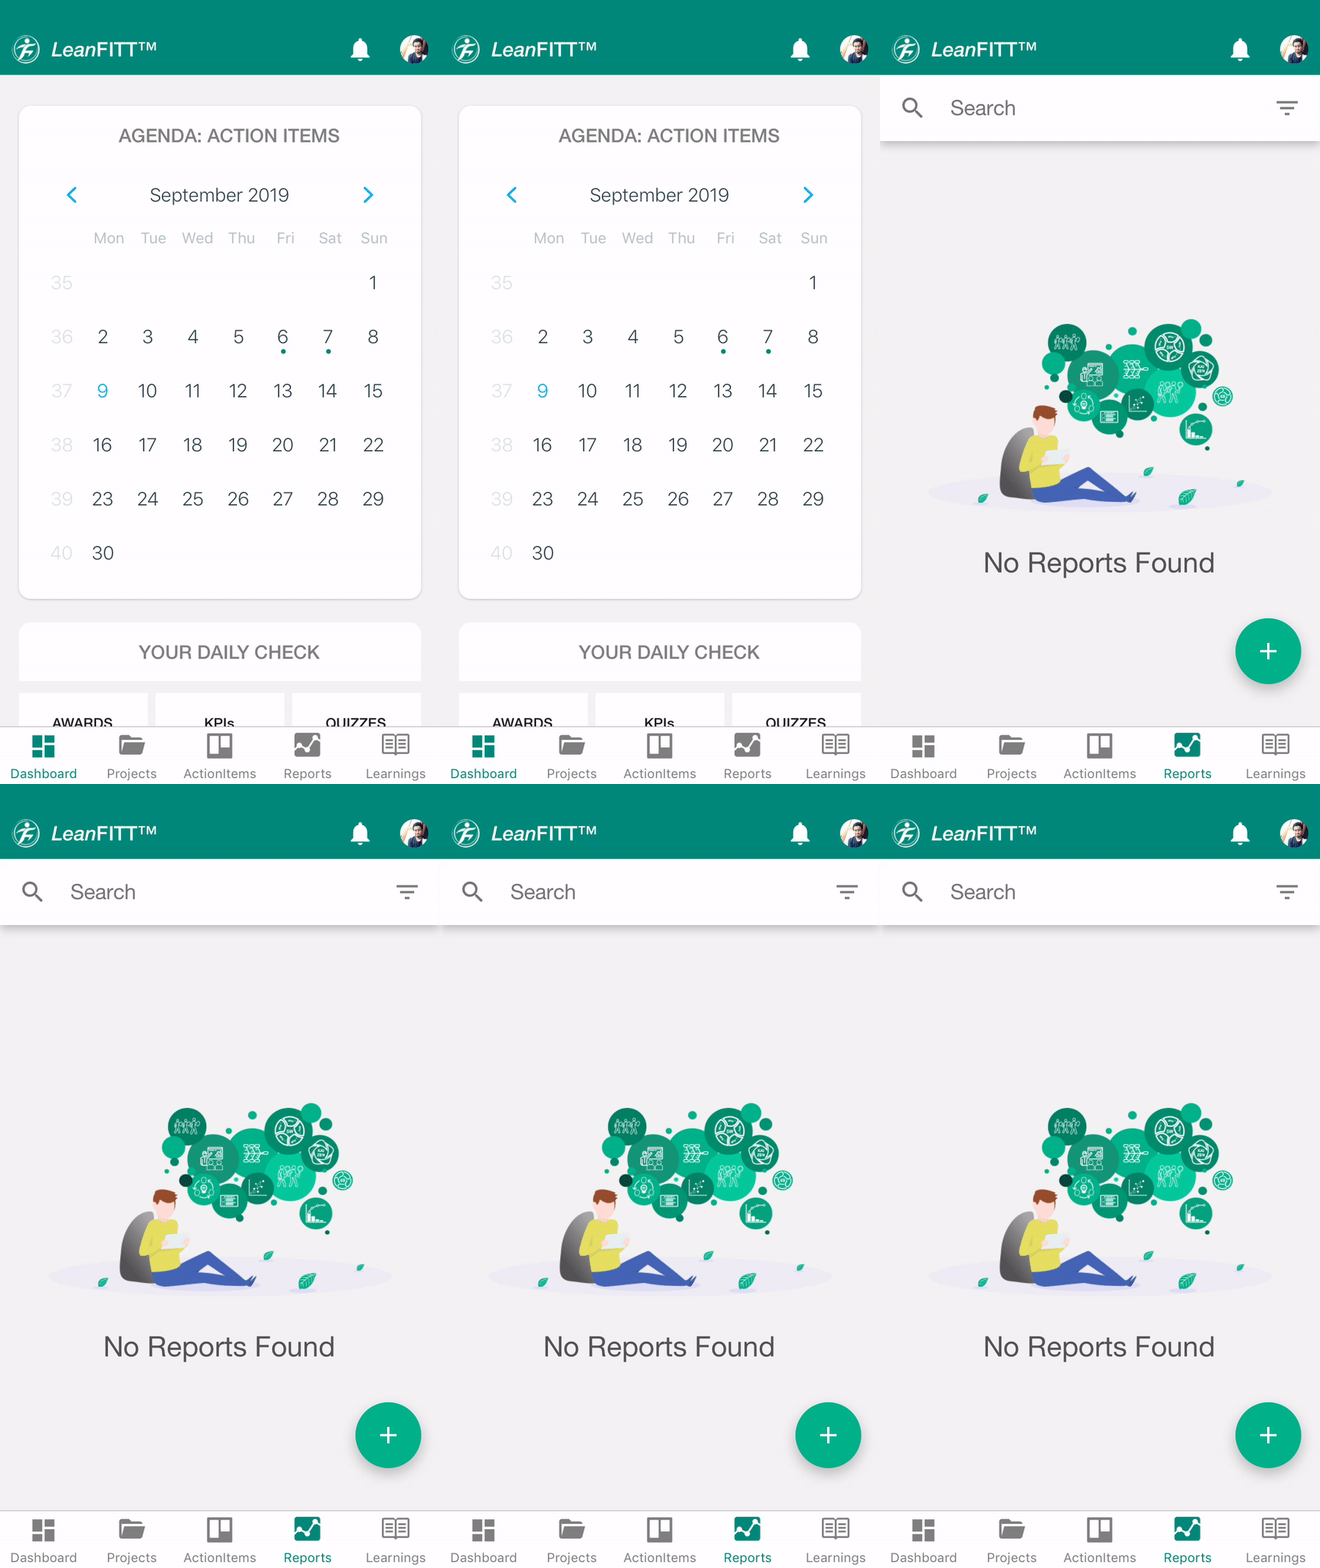
- STEP 1: Tap on the “Reports” from bottom menu, you will now visit a “Report List Page” (under reports)

- STEP 2 : In the “Report List Page” you will get one filter icon on the top right navigation, by tapping on that icon, where you will get options like, FILTER, PROJECTS, DEPARTMENTS, USERS and back to report list on the right side corner you can see one “+” floating icon, by tapping there you can create a new report.

- STEP 3: After that tap on the “+” and a selection report list will open. Now select “VALUE STREAM MAPPING” from the entire list, Then you can give a TITLE name (For eg. I have given a Title called “TRIAL”), now you can also select a “PROJECT NAME” which is the third button. Then finally tap on the “CREATE” button to create this report

- STEP 4: On the Lean VALUE STREAM MAPPING dashboard, where you can see on the top right all options

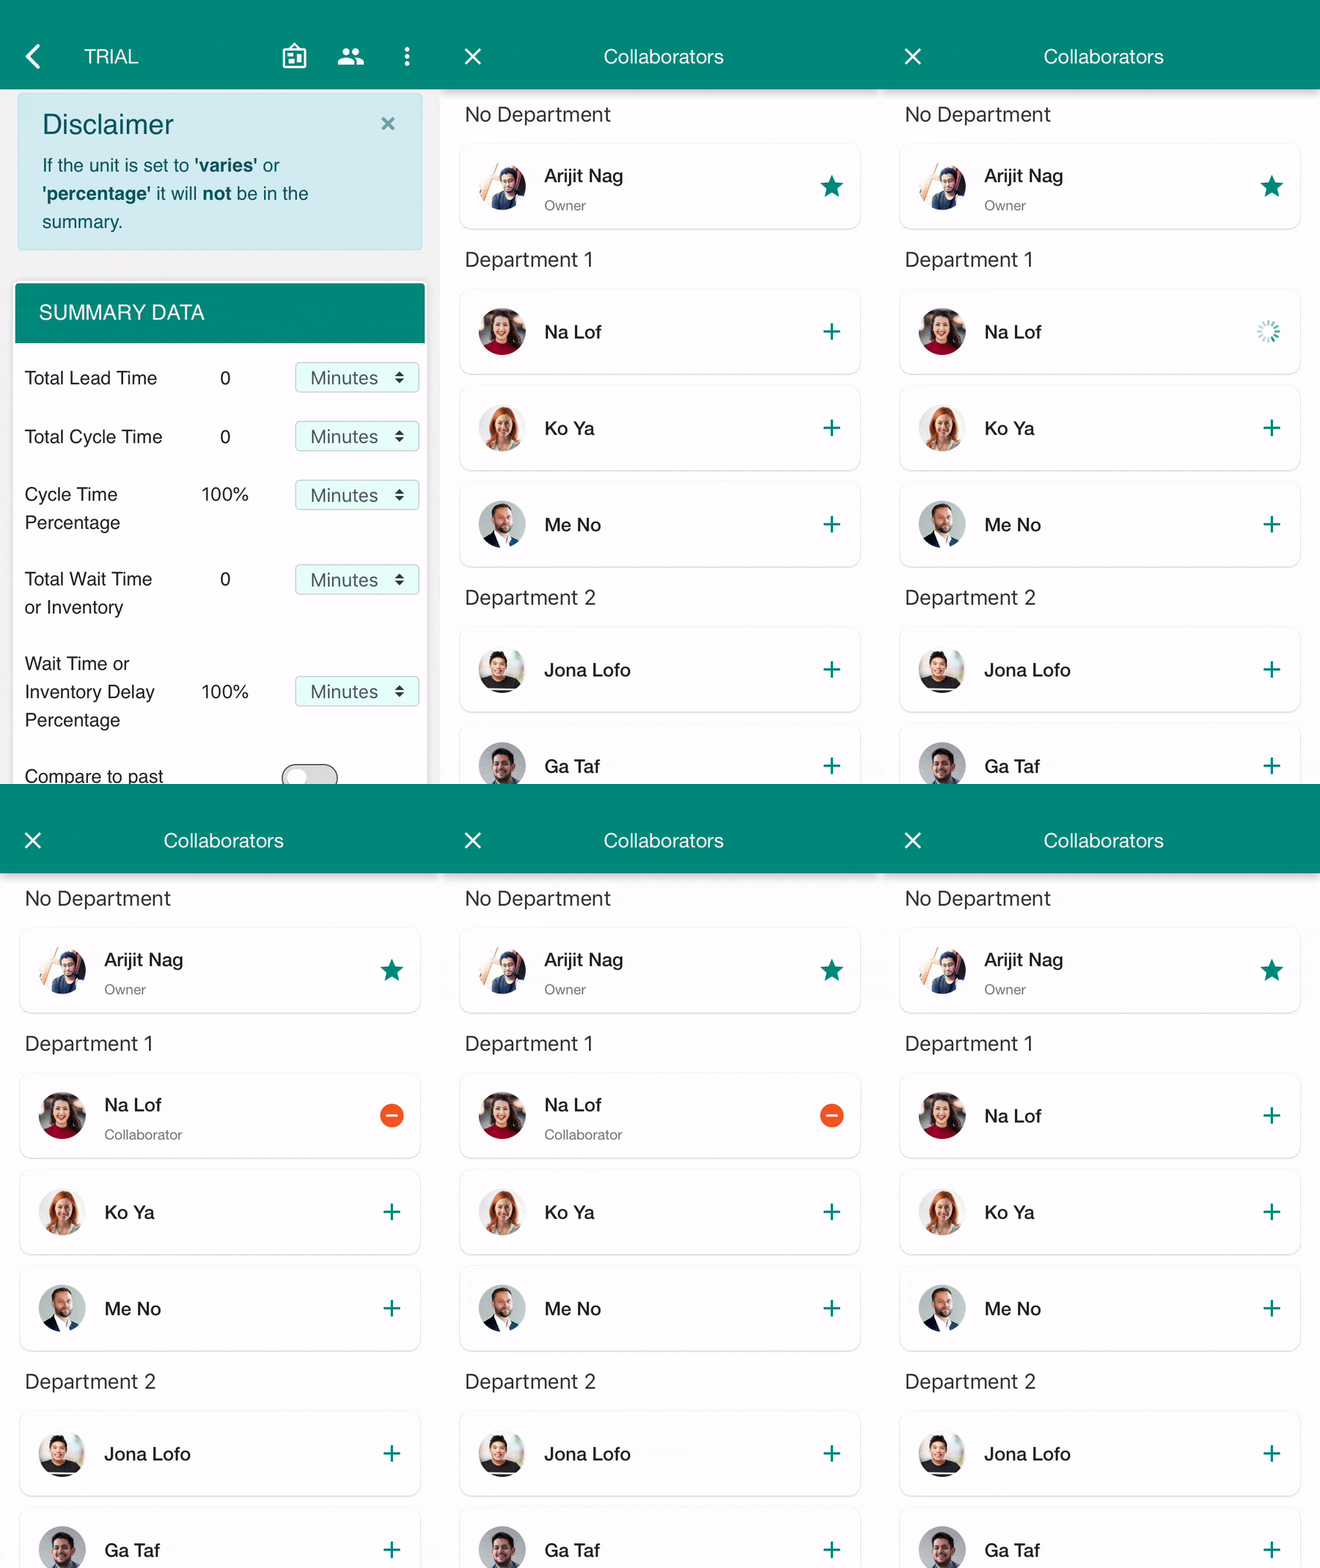
- STEP 5: To add your collaborator under this report, you can tap on the second option on the top right option which is “COLLABORATORS”, From there you can add as well as remove collaborators.

- STEP 6: Summary Data – This is the section where you can have total results for VSM processes. Also, you can compare to past state

- STEP 7: Demand Data – In this section, Where you can have your demands for production.

- STEP 8: Information Flow – In this Information flow section, you can add process details. Kaizen Project – This section is for details about continuous improvements.

- STEP 9: Wait Time or Inventory – Before starting a new process, you can set the wait time or inventory, Waste Walk – This section is for sorting waste. Before starting a new process, you can also add Waste notes.

- STEP 10: Process Part – You can also add Waste Walk notes in this card. Edit your process name if you want. After that Cycle time which is the process 1 total time. Now Cycle Efficiency which is ( Total good time/total cycle time ) X 100. Then add attributes(Needs) for process 1. If you want to see cycle time as the sum of these attributes value then you have to toggle this on. Then add attributes(Needs) for process 1. If you want to see cycle time as the sum of these attributes value then you have to toggle this on. After that attach Images for process 1. After completing a Process you can set Wait Time or Inventory if any. Meanwhile, sort some waste and then move on to the next process.

CREATE ACTION ITEMS :
- STEP 11: Now in this step, you can create an Action Item by tapping on ACTION ITEM/NOTE Option under Action item

- STEP 12: now after tapping on ACTION ITEM list icon one new Action Item list page will open, where you can create new action item by tapping on the “+” floating icon on the bottom right.

- STEP 13: Now when you taped on the “+” floating icon, one new modal will open where you can see multiple options.

- STEP 14: Nowhere you can Enter title, Enter the description and add attachments (photos or videos) , for eg. here I am entering title as “TRIAL”, Description as “Management work”, and adding one attachment.

- STEP 15: while you are creating notes, it will not be visible on the action item board.

- STEP 16: at the time of creating the action item, you can set a due date, you can add action item status ( there are three action item status TO DO, IN PROGRESS, IN REVIEW and DONE), Select report, add assignee and then tap on CREATE.

- STEP 17: now after creating the action item you can go to action item option from top right navigation there you can see the existing action item which you have created.

- COMPLETE THE REPORT :
- STEP 18: And finally to complete the report you can go to the upper right navigation and select “MARK THIS REPORT AS COMPLETE” from action to complete this report and you will get an award for the report.


Leave A Comment?