CREATING REPORT :
- STEP 1: Click on the “Reports” from left navigation, you will now visit a “Report List Page” (under reports)
- STEP 2: In the “Report List Page,” you will get some options on the top, e.g., Department, User, Project, Type and Search bar. When you are creating the report for the first time, you will get the “CREATE NEW REPORT” button on the middle. If the report list is not empty, then the CREATE button will be at the top right of the page.

- STEP 3: After that, click on this “CREATE” button and a modal will open. From this “CREATE” Modal select your report “Scatter Plot” from the dropdown list, Then you can give a TITLE name (For, e.g., I have given a Title called “TRIAL”), now you can also select a “PROJECT NAME” this is the optional field. Then finally click on the “CREATE” button to create this report.
- STEP 4: Inside Scatter plot Report you can see two options “ACTION & ACTIVITY” in the upper right navigation
ADD COLLABORATORS :
- STEP 5: Then you can go to COLLABORATOR option under ACTION to add collaborators, so here you can add collaborators from “ORGANIZATION USERS.”
- STEP 6: after opening the SCATTER PLOT page, you can see “NO CHART DATA FOUND” below that you can see two options “EDIT” and “ADD NEW.”
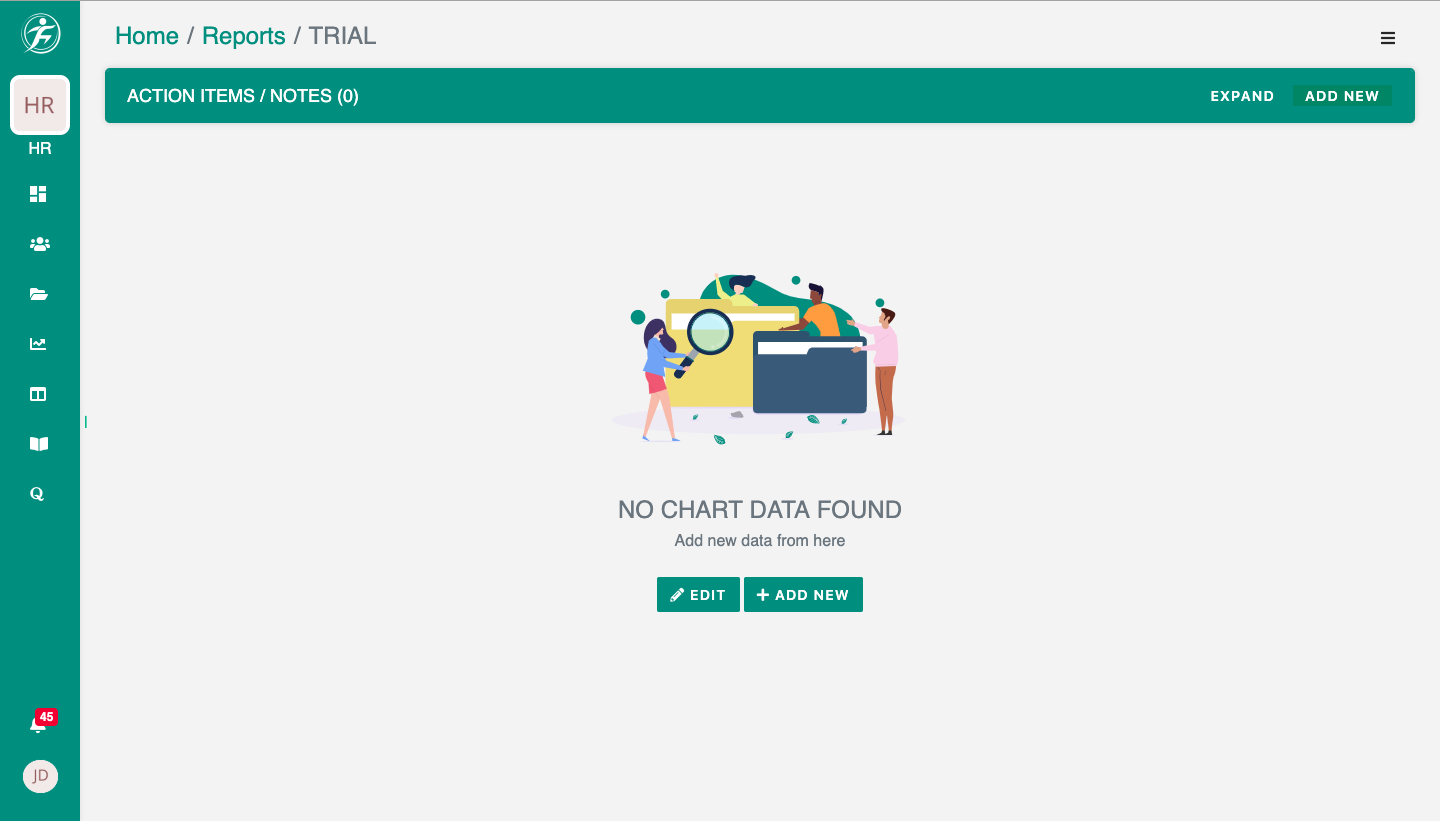
- STEP 7: Then you can click on the “ADD NEW” button to add a new chart. One new data table will open below, where you can see input fields like “X VALUE,” “Y VALUE,” “DESCRIPTION,” “ADDED BY,” “ACTIONS.”
- STEP 8: Now in the next step you can add “LABEL,” “VALUE,” “DESCRIPTION” (For, e.g., I have given X value as 55, Y Value 65, Description as “working fine”)
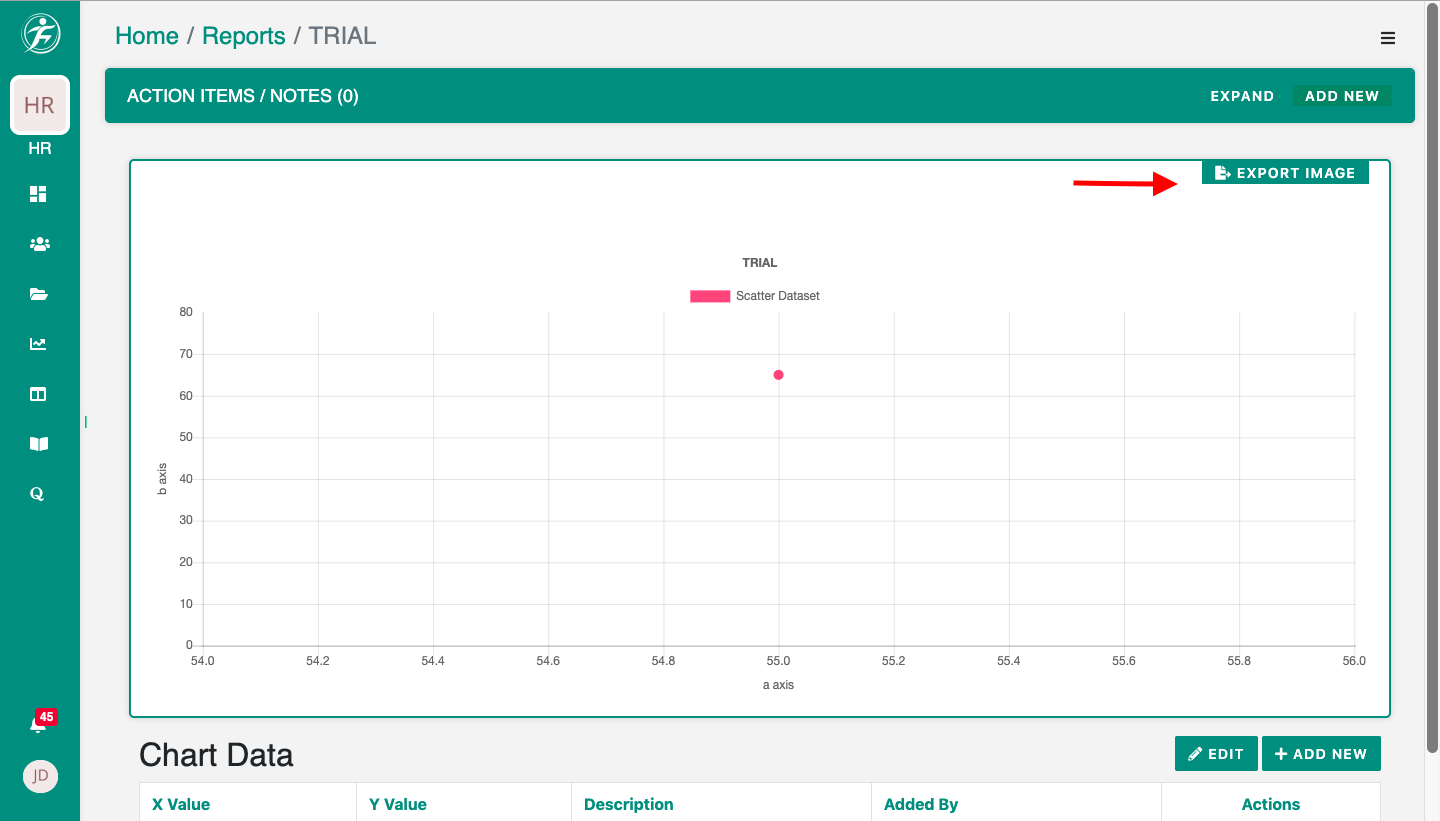
- STEP 9: After entering all the relevant data, you can save it, so one new page will open, where you can see the graphical representation of the data. The chart will generate according to the data you will provide.
- STEP 10: So you can also edit the data from the below edit option, you can edit axis names here, then you can SAVE it
- STEP 11: Now, you can see one option EXPORT IMAGE, from where you can export the image of this total graphical representation.
CREATE ACTION ITEMS :
- STEP 1: Now in this step you can create an Action Item by clicking on this ADD NEW button

- STEP 2 : after clicking on the ADD NEW button you can see your Action item modal, In this modal you can see different options, like
- “Add a title here” – you can add the title of the action item here.
- Description – here you can write description about action item.
- Attachments – you can add any file (photos/videos) regarding action item
- Due Date – You can select the due date of this action item, for NOTES you do not need due date
- Note & Action item – here you can select either NOTES or Action item
- STEP 3 : Now for example if you are selecting NOTES, you will have two options one is SELECT PROJECT and the second one is SELECT REPORT. But here either one of them you can select, for eg. I have selected report “TRIAL” here so I cannot select PROJECT. You can also select assignee for this particular note from the dropdown.
- STEP 4: Secondly if you are going to select ACTION ITEM option, you can add DUE DATE for action item, then you can select action item options like “TO DO”, “IN PROGRESS”, “IN REVIEW”, DONE”. After selecting there action items you can select either project or report just like before, and at last you can select assignee. And then click on “CREATE” button.
- STEP 5 : Now after creating the ACTION ITEM it will be saved, then you can see the existing ACTION ITEM by clicking on the “EXPAND” option.
COMPLETE THE REPORT :
And finally to complete the report you can go to the upper right side corner of the dashboard, then you can click on the “MAKE THIS REPORT AS COMPLETE” option, so after that, you successfully submitted the report and will get an award for that.

Leave A Comment?