- Step 1: Tap on “+” floating icon to open Create KPI modal. From this KPI modal you can add TITLE name ( here I have given a title called Production ), after that you can add X-AXIS & Y-AXIS label ( for, e.g., I have added XL, YL ) , then select TREND for this KPI “positive” or “negative” ( I have selected positive ), select target for this KPI ( for eg. I have entered 100 ), after select KPI “START DATE & END DATE”, Then finally click on the “CREATE” button to create this project KPI.
- Step 2: Tap on top right more option to edit KPI, and delete KPI.
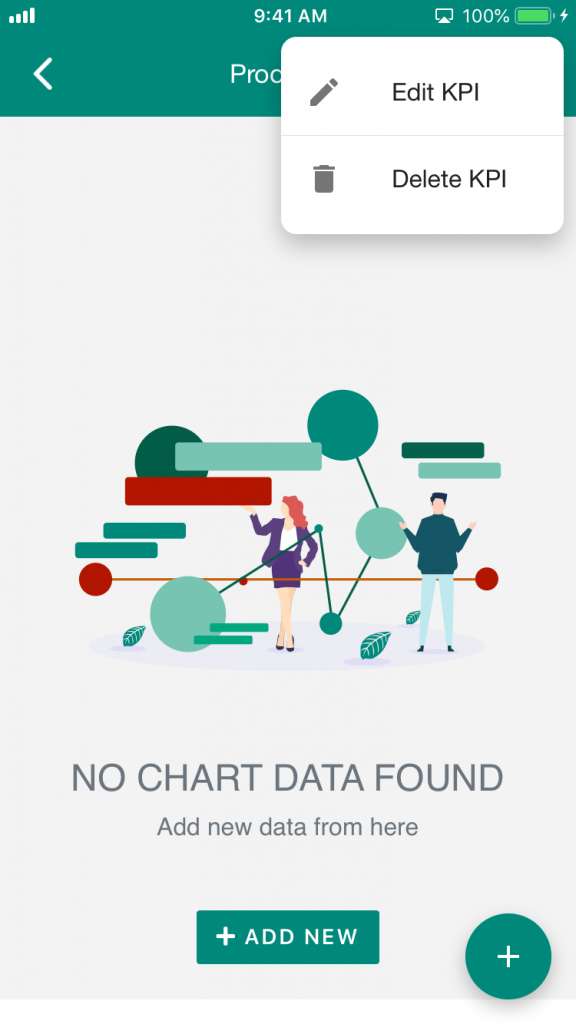
- Step 3: You can see on center “ADD NEW” button tap on this to create KPI chart. From the KPI chart, you can add x-value and y-value, then select “DATE” from the dropdown, after that, you can give KPI description And finally tap on the add button to add this KPI.

Leave A Comment?